Low-Stress Bicycling Networks

by Darren Flusche
Published by the League of American Bicyclists
When the top minds met in Washington, D.C. this month for the Transportation Research Board Annual Meeting, the concept of low-stress bicycling networks was the talk of the conference. Pioneered by Northeastern University Professor Peter Furth and others, Level of Traffic Stress (LTS) analysis has brought to the forefront a means to identify barriers to riding for people with a low tolerance for traffic.

Tim Blagden, Bike-Walk Alliance of New Hampshire
It’s a Big Idea that’s taking root across the country and we’re excited to hear more on this timely topic from Tim Blagden, Executive Director of the Bike-Walk Alliance of New Hampshire, at the 2015 National Bike Summit in March.
Click here to learn more about the Summit agenda.
To preview his Big Ideas presentation, Blagden shared with us five reasons he thinks they are so important and effective planning and advocacy tools. Here’s what he told us…
1. Level of Traffic Stress analysis is built directly on mainstream adult reaction to street infrastructure.
Fear is the overwhelming reason given for not using active transportation. Having a fundamental model that relates fear directly to street attributes means we are directly addressing the #1 impediment to adopting active transportation. It’s ski season up here in New Hampshire, so here’s an analogy: Low-stress streets that connect to places people want to go are the beginner slopes of bicycling. If there aren’t sufficient beginner slopes we will fail to attract enough participants to the activity. Once people gain proficiency they can ride on more difficult terrain, but getting them in requires fun, useful, calm areas that get them where they’re going. We’ve lost a tremendous percentage of our ‘beginner slopes’ over the last 40 years as we’ve helped cars go further faster. We have to start clawing our way back.
2. The Level of Traffic Stress maps are visual.
In the map below, there’s a large area of low-stress streets in green just above the map key. There’s another large block of low-stress streets to the right of the map key. If we tell a person looking at this map that the orange streets will kill a trip by being too stressful to cross, almost everyone can identify linking the two large green areas as a place to focus some attention. One short linking project increases the connectivity of the network dramatically.
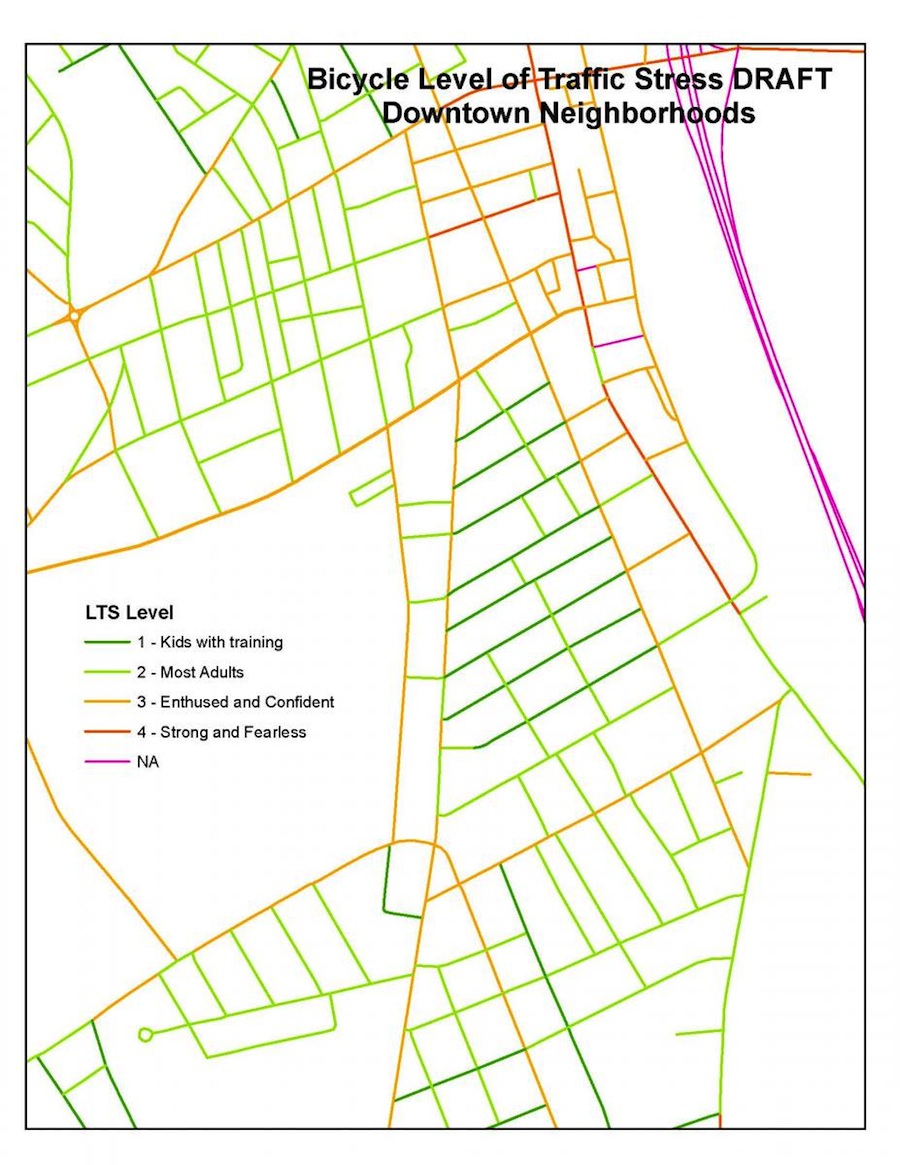
An example of what a “Level of Traffic Stress” map looks like.
3. The idea of Level of Traffic Stress builds continuous momentum.
The denominator is the entire street network — it remains fairly constant. The numerator is the level of connectivity — this can be constantly improved. So LTS provides both DOTs and advocates a more objective way to measure status and progress. With a network view prior year’s projects relate to current and future projects. With a project-only focus, year after year, projects are done well and everyone is congratulated, but the overall connectivity may not improve. We need the network to anchor the focus.
4. Caring about the Level of Traffic Stress network amplifies the voice of those who historically have been underserved.
Project-focused efforts happen more in areas where people have the time and energy to invest in pushing for those projects. By putting emphasis on improving the network, attention is drawn to areas of lousy infrastructure. The gap becomes glaring when poor neighborhoods remain cutoff from the rest of the network.
5. The network is at the center.
Transportation departments already think in terms of the network they develop and manage. By taking a network view, it moves bicyclists closer to our counterparts in DOTs and shows that we too realize all projects are done to improve the network.
The public likes Level of Traffic Stress analysis because it’s visual and based on shared emotional reactions to the environment. People bond with the approach. Planners like LTS because its network focused and based on objective data that is straightforward to gather. I like LTS because it draws people together, provides continuity, improves equity, and focuses on usable connectivity.

Darren Flusche is the policy director of the League of American Bicyclists.