
Best of Bike Delaware 2015: “How To Make Cycling Work for Half a Million People in Delaware”

Looking Back at 2015: This article was originally published on April 28, 2015. It was the 4th most viewed Bike Delaware article of 2015.
5 years ago, Bike Delaware went through a long and arduous strategic planning process. One of the most important results of all that effort was our organizational “vision“.
Bike Delaware has both a “mission” and a “vision”. Both are critical. They are our compass, our lodestar, our flashlight shining into the future. They keep us on track and focused.
What is the difference between the two? I think of them as very similar but a “mission” is more abstract and general while a “vision” is more specific. A good analogy is: the mission is the journey. The vision is the destination.
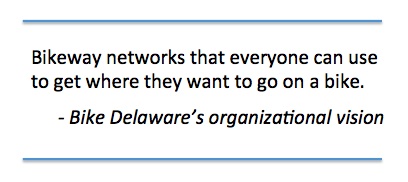 Bike Delaware’s mission – the reason the organization exists – is to make cycling a safe, convenient and fun transportation option in Delaware. That’s the journey we are on. But what direction are we going? That’s where our vision comes in. Bike Delaware’s vision is bikeway networks – connected routes that are designed for cycling – that everyone can use.
In order to make this vision a reality, we first need the language and tools to describe what a bikeway network is and who would be comfortable using it to get around.
That’s why Bike Delaware is incredibly excited that DelDOT has hired Civil Engineering Professor Peter Furth (Northeastern University) as a consultant to help implement a new tool to help plan effective, safe, and well connected bikeway networks. Dr. Furth’s method is called “Level of Traffic Stress Analysis”.
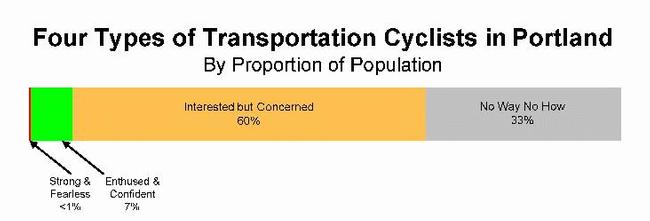
From Roger Geller’s analysis of cyclists in Portland, Oregon. While regional differences in these numbers probably exist, Geller provides an intuitive way to think about how the population breaks down by confidence and tolerance for traffic stress – each population having a particular comfort zone and willingness to tolerate traffic stress.
The basic idea behind Level of Traffic Stress analysis is that everyone has a particular tolerance for “traffic stress” – the physical and mental stress induced by automotive traffic. Think of it as a comfort zone for cycling around town.
If a particular trip contains a segment which is out of a cyclist’s comfort zone, he or she will find a less stressful detour. But if no reasonable low-stress detour exists, cyclists may choose to try to manage that trip segment by dismounting and walking, or riding on a sidewalk or even on grass. Most likely (if the option exists), he or she will simply not cycle at all and instead accomplish the trip via another mode.
Whenever a cyclist is unable to get from point A to point B within their comfort zone and without unreasonable detour, that is a failure of infrastructure. Or, to make the same point in a more positive and optimistic way, that is an opportunity for improvement.
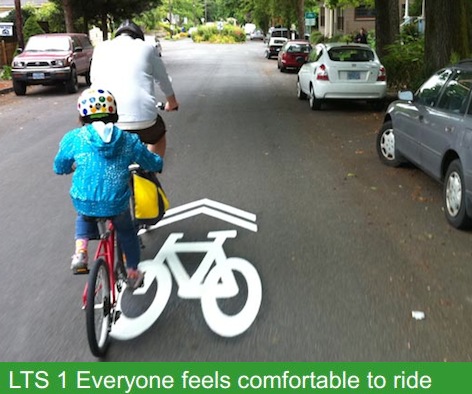
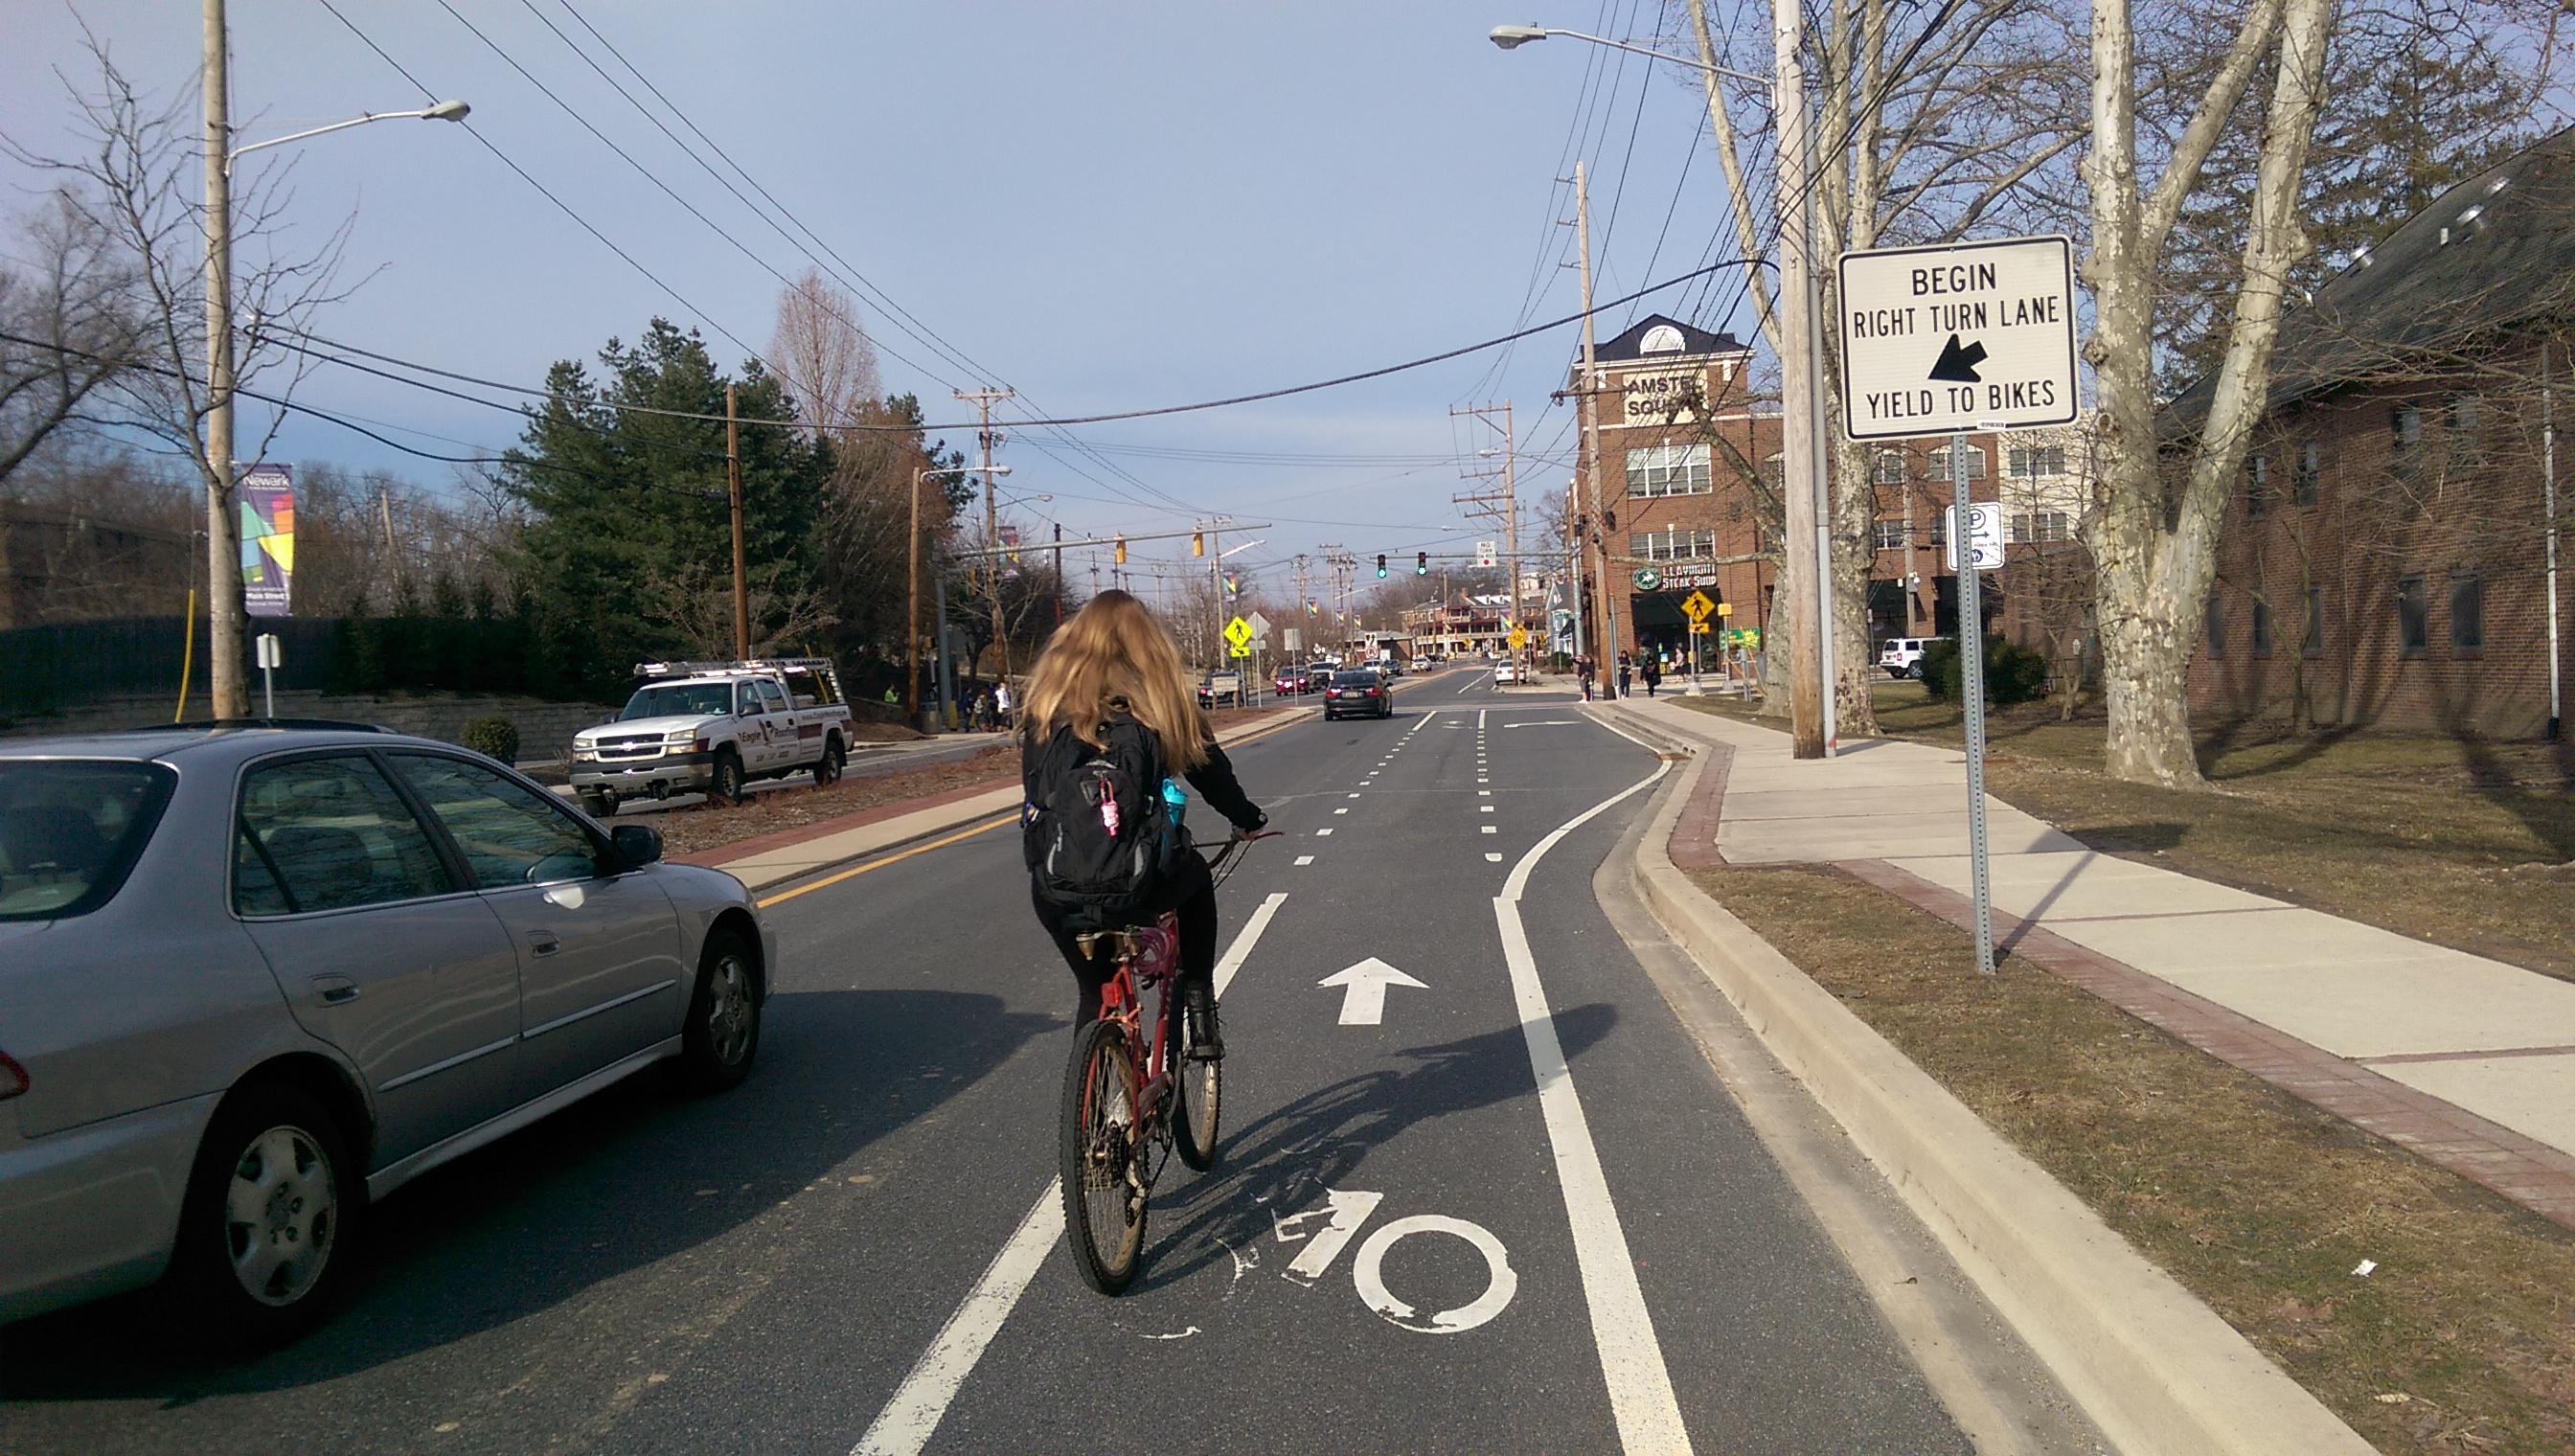
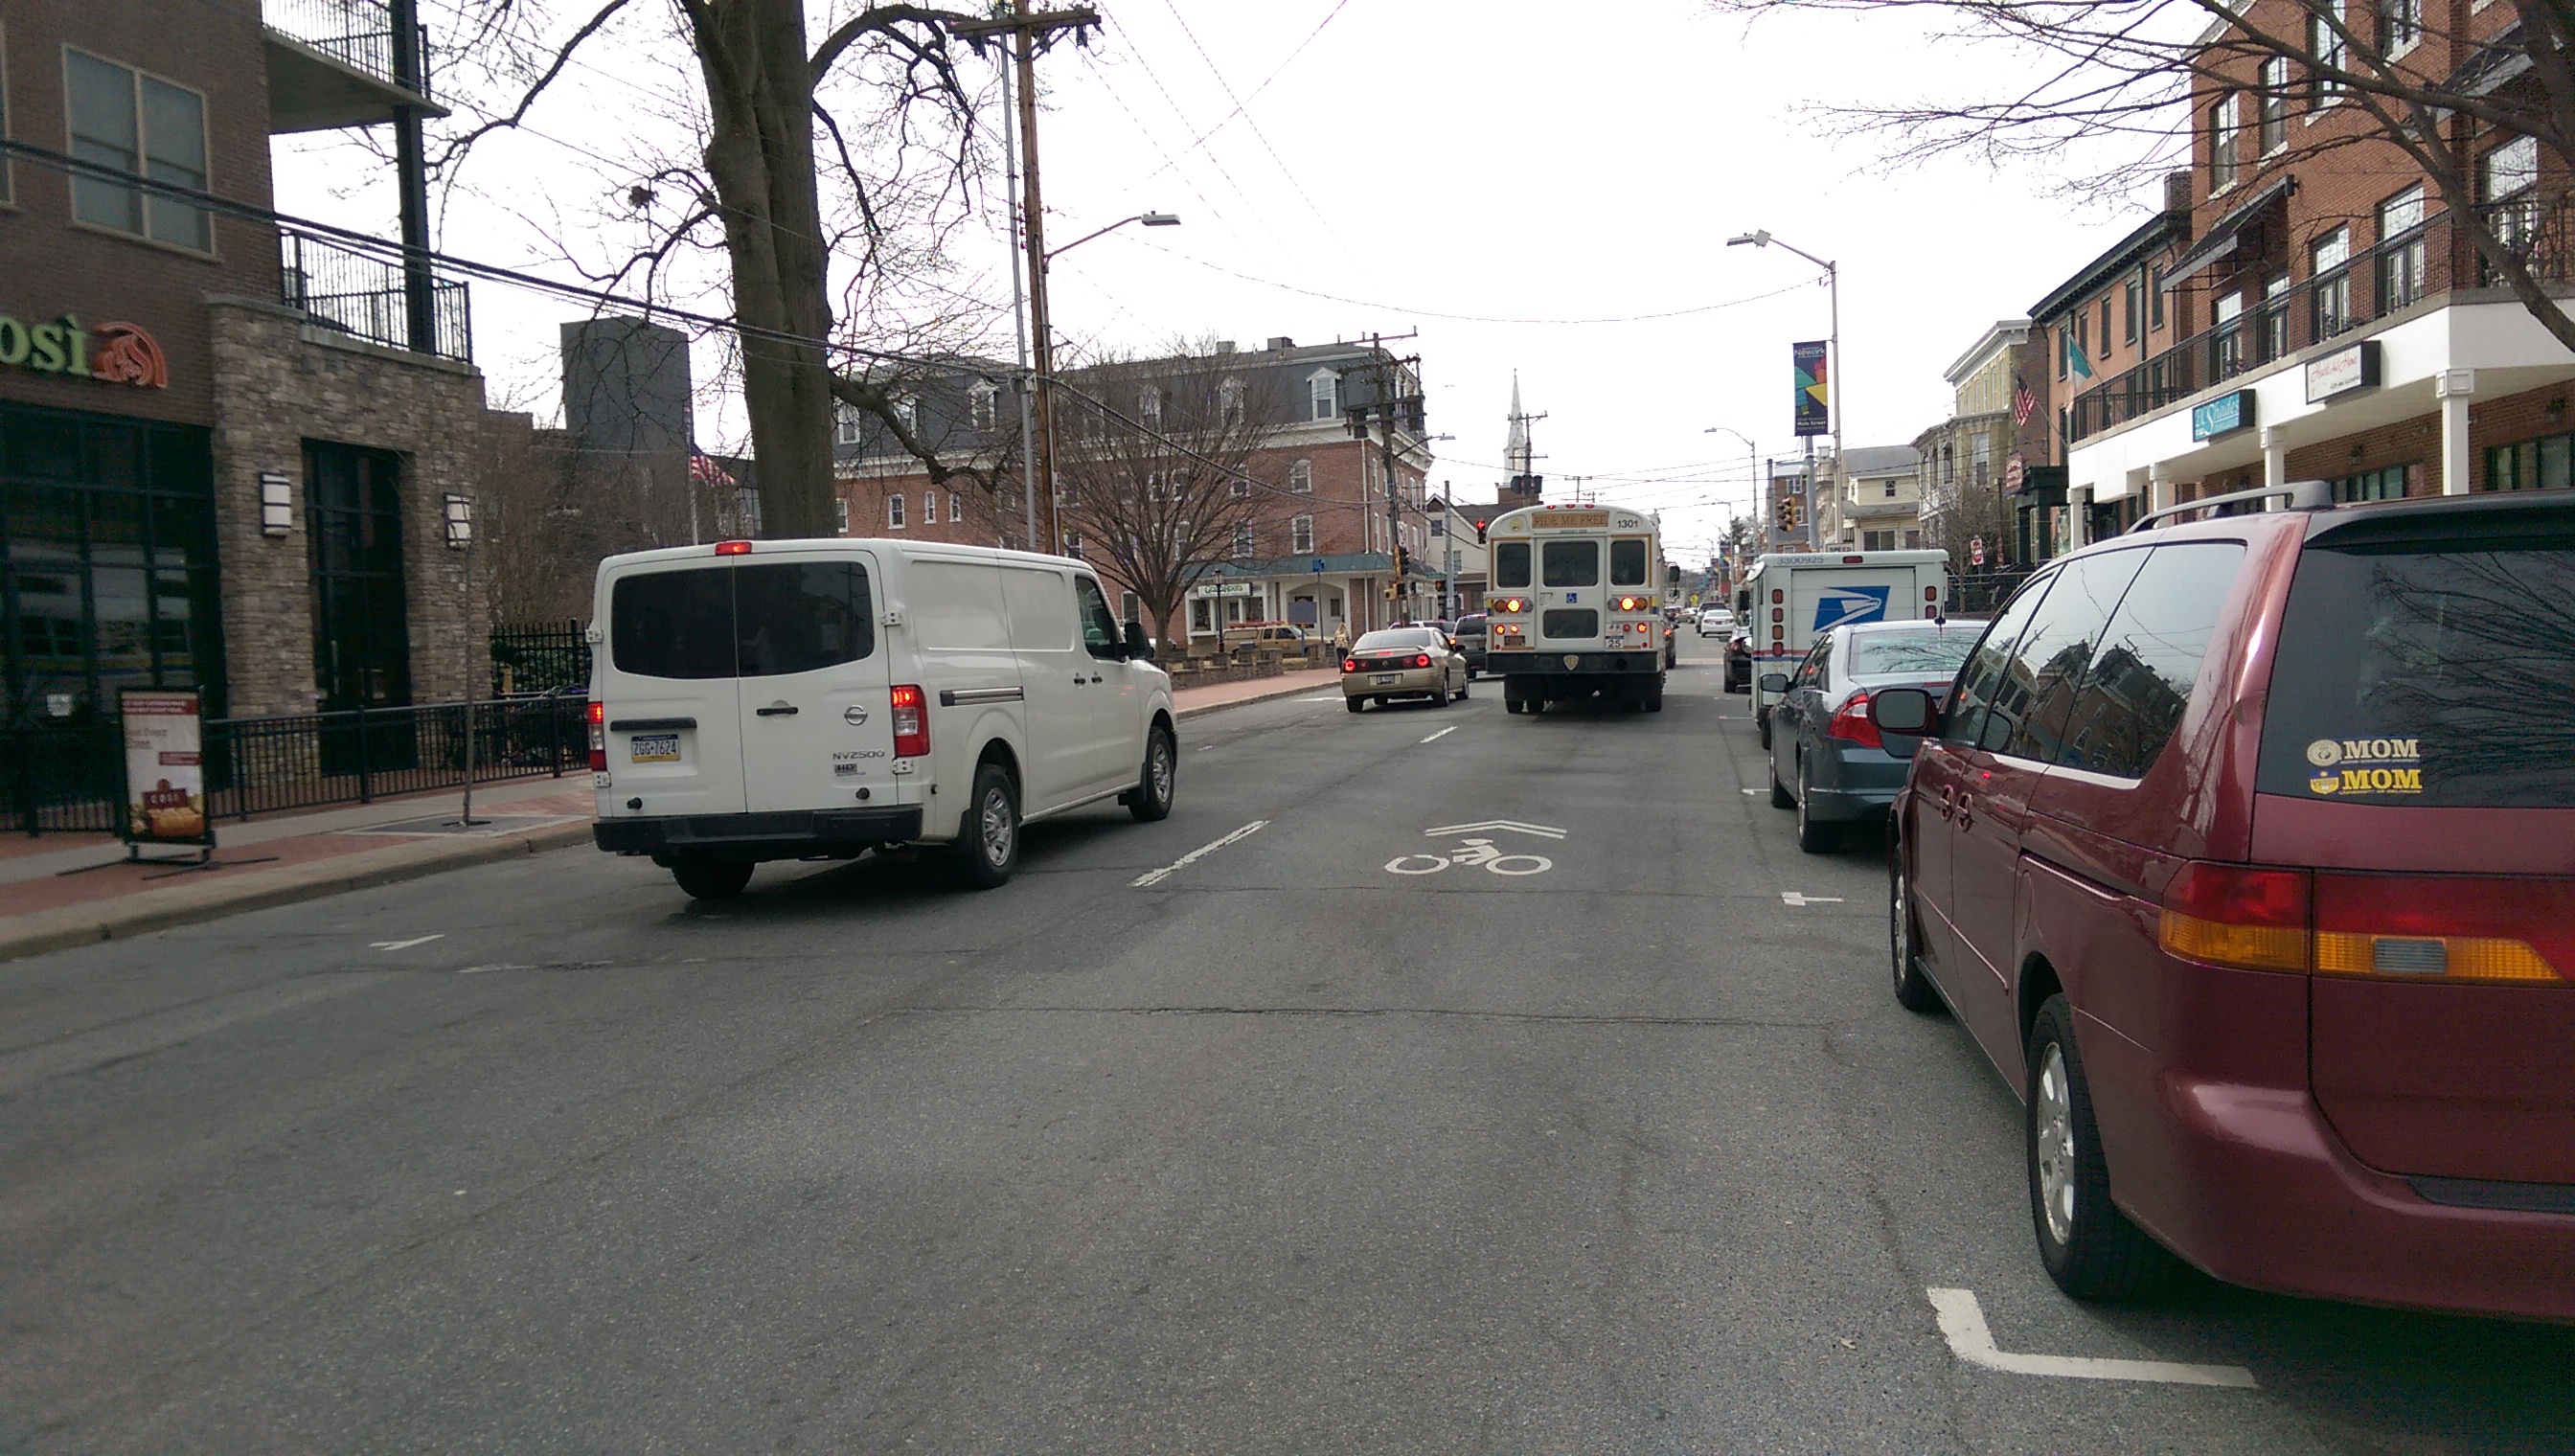
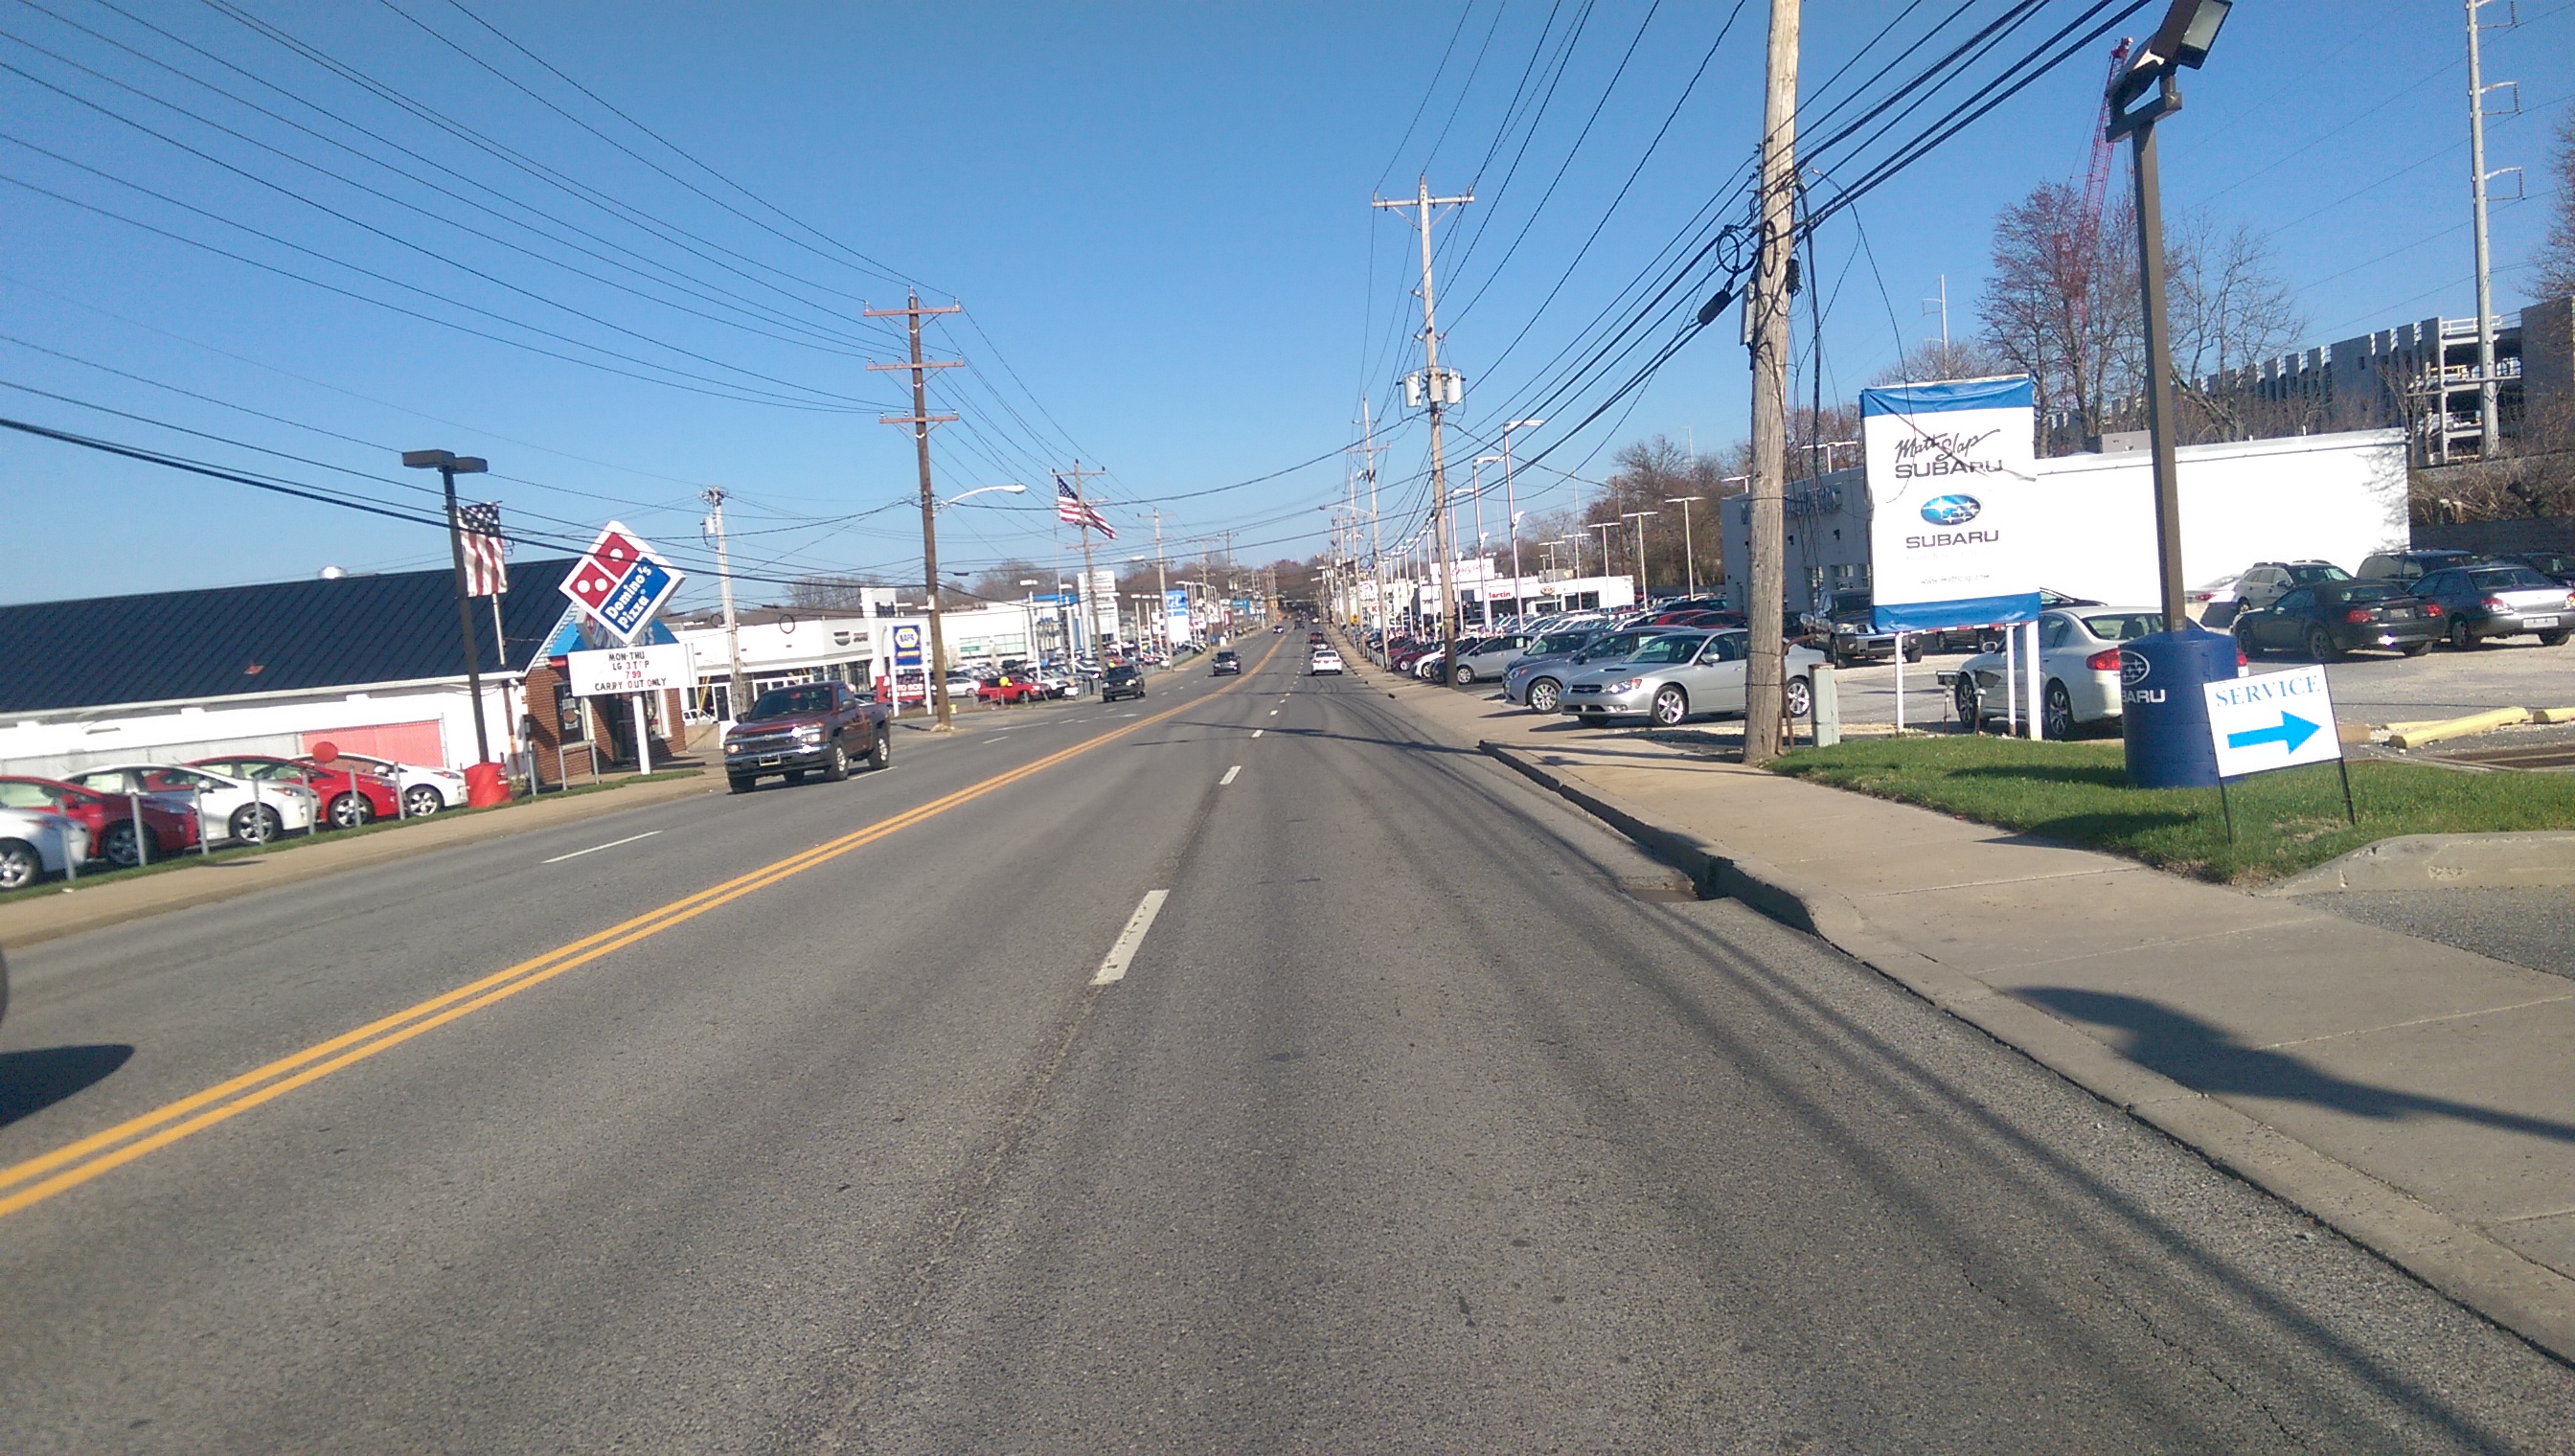
In Level of Traffic Stress (LTS) analysis, roads, streets and pathways are rated on a simple scale from 1 to 4. The LTS is determined by a few simple, intuitive inputs that affect how people riding bikes typically interact with the street. Are there bike facilities present? If so, what kind? How wide are they? Do cyclists have to share the roadway with cars? What’s the speed limit? Are intersection crossings safe? These factors are then used to determine the LTS designations for route segments and intersections.
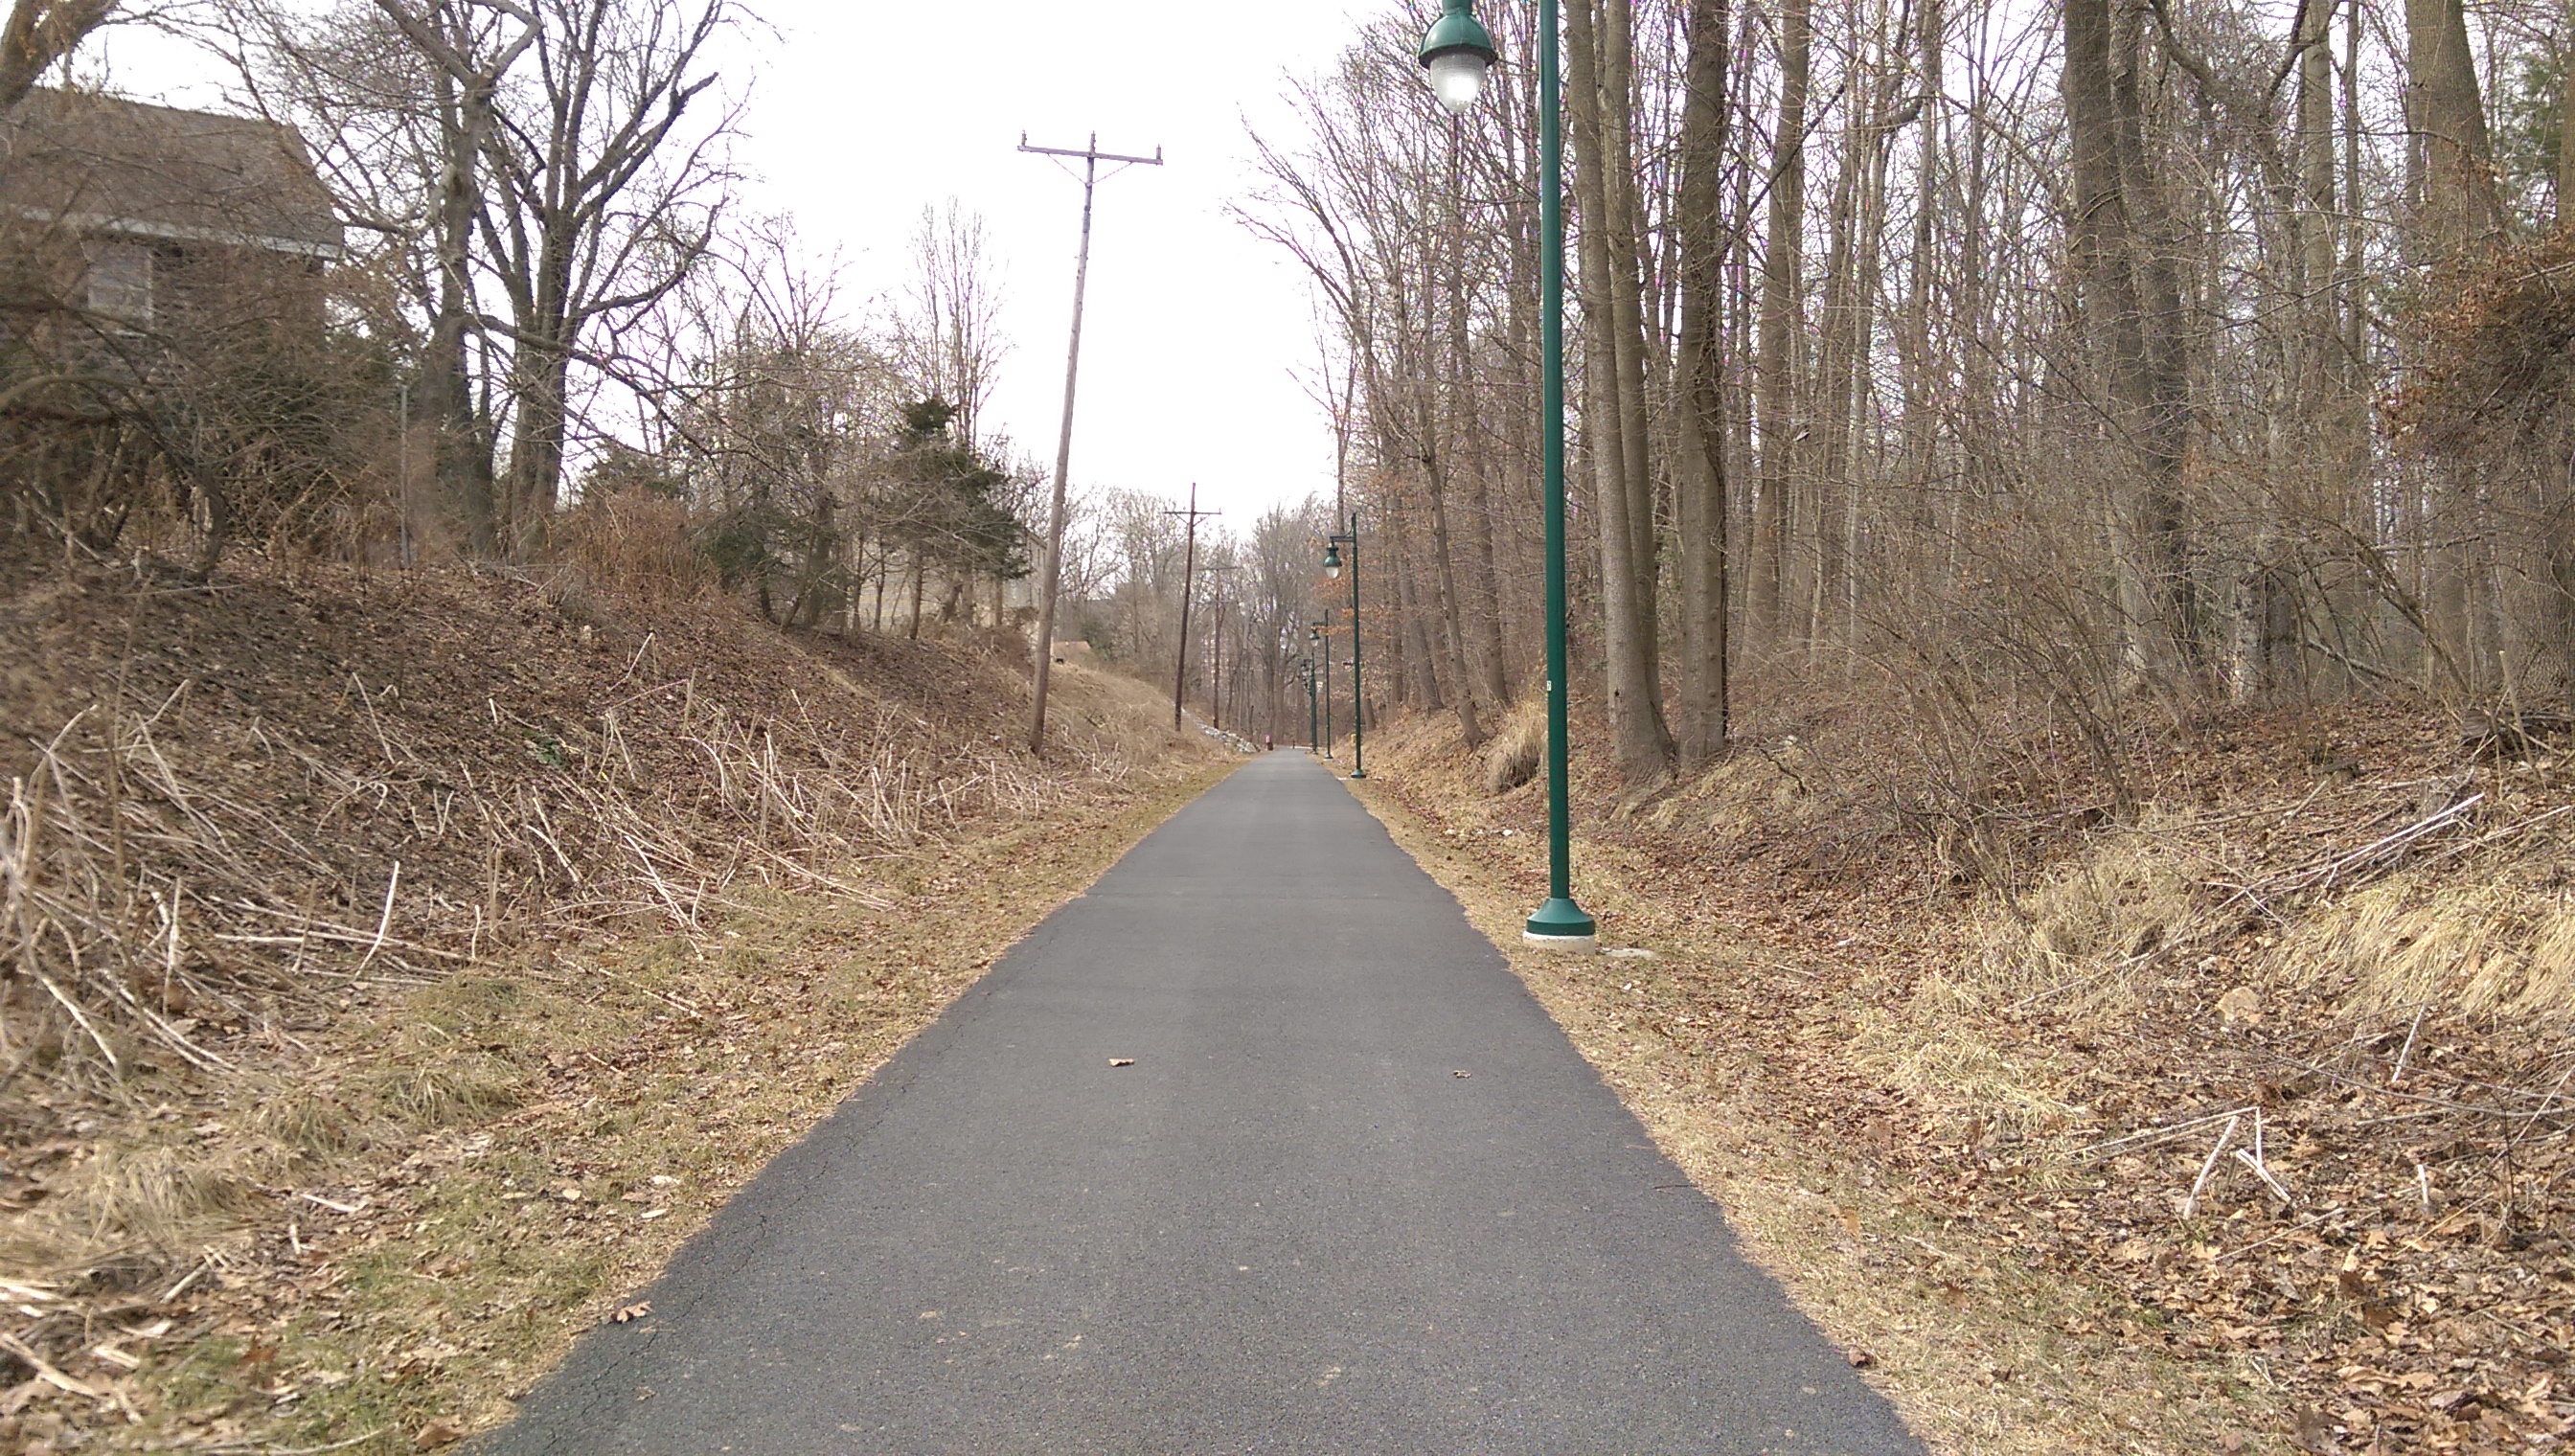
To make cycling comfortable for the widest possible population, most cycling trips from beginning to end should be possible using low-stress streets or pathways (i.e.”LTS 1″ or “LTS 2” routes). The collection of such existing routes is the low-stress bikeway network. Using LTS analysis, we can determine the size of the low-stress bikeway network, where it goes, estimate how many people have access to it, how many of their daily trips are feasible under low stress conditions and – most importantly – how the addition of new infrastructure would likely affect these numbers.
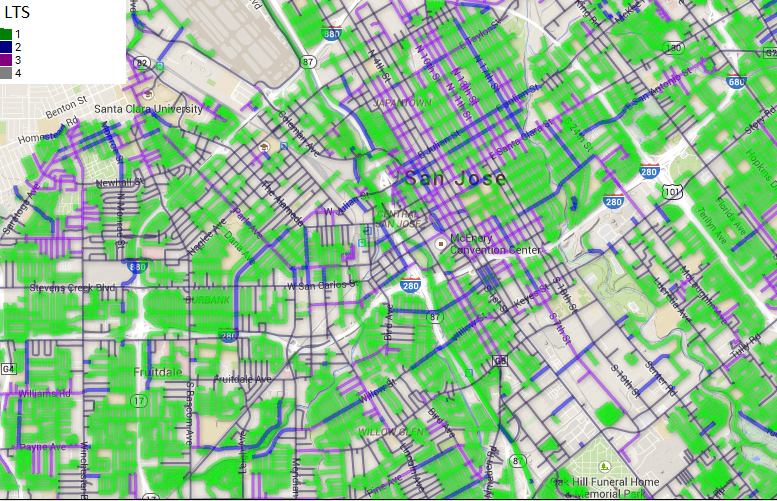
This map shows the bicycle network accessible to the Strong and Fearless type in San Jose, California – essentially anything they’re crazy enough to ride on short of express-ways.
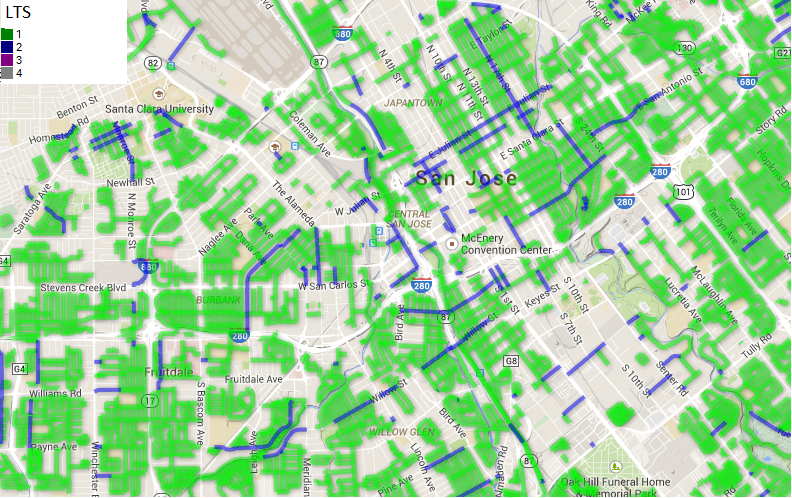
And this map shows the Low-Stress Bicycle Network – the network of streets and paths at LTS 1 and LTS 2 conditions. Clusters of low-stress streets are disconnected from one another by high-stress segments, creating “low-stress islands”. This fragmentation of the bikeway network prevents safe, comfortable travel across the city. These maps present an incredibly useful visual to assist in planning new infrastructure to bridge these gaps and make a larger area accessible at low-stress conditions.
In Delaware’s 2014 Bicycle Friendly Report Card, the League of American Bicyclists’ #1 recommendation was to “Develop a capacity to analyze bicycle travel in terms of the percentage of trips that can be made under low traffic stress conditions” – exactly what LTS Analysis offers. When this tool is integrated into future planning efforts, DelDOT will gain profound new insight into how new pathway and roadway projects affect the area’s bikeability and relation to the existing bikeway network. And Bike Delaware will gain a needed quantitative tool that we can rely on to make our vision of bikeway networks – that everyone can use to get where they want to go – a reality.
Special thanks to the University of Delaware Office of Service Learning for supporting this project.
If you would like to learn more, a presentation on Delaware’s current efforts to develop Level of Traffic Stress analysis will be part of the program of the 2015 Walkable Bikeable Delaware Summit on May 7. The summit is free and open to the public. Register HERE.
Maps of San Jose were generated from interactive maps by Axum Design and Engineering.

Paul Moser is a Bicycle Network Planning Intern at Bike Delaware. He studies civil engineering at the University of Delaware and works with DelDOT as a consultant on Level of Traffic Stress analysis.


One Response
Bicycling is one of my favorite outdoor activities. I would like to visit whole world by riding my bike. Thank you for sharing awesome information here.